Getting Started with Cloudera Navigator
Cloudera Navigator features and functions are available through the Cloudera Navigator console, a web-based user interface provided by the host configured with the Navigator Metadata Server role (daemon). The Cloudera Navigator console invokes the REST APIs exposed by the web service provided by the Navigator Metadata Server role instance. The APIs can be called directly by in-house, third-party, and other developers who want to further automate tasks or implement functionality not currently provided by the Cloudera Navigator console. This topic discusses both of these interfaces to the Cloudera Navigator metadata component.
 Note: Navigator Metadata Server is one of the roles (daemons) that comprises Cloudera Navigator. The
other role is Navigator Audit Server. See Cloudera Navigator Data Management for details.
Note: Navigator Metadata Server is one of the roles (daemons) that comprises Cloudera Navigator. The
other role is Navigator Audit Server. See Cloudera Navigator Data Management for details.The following steps assume that the Cloudera Navigator data management component is running, and that you know the host name and port of the node in the cluster configured with the Navigator Metadata Server role. See Cloudera Installation and Cloudera Administration guides for more information about setting up Cloudera Navigator.
Continue reading:
Cloudera Navigator Console
The Cloudera Navigator console is the web-based user interface that provides data stewards, compliance groups, auditing teams, data engineers, and other business users access to Cloudera Navigator features and functions.
The Cloudera Navigator console provides a unified view of auditing, lineage, and other data management capabilities across all clusters managed by a given Cloudera Manager instance. That is, if the Cloudera Manager instance manages five clusters, the Cloudera Navigator console can obtain auditing, lineage, metadata management, and so on for the same five clusters. Cloudera Navigator uses its technical metadata gathering feature to keep track of which cluster originates the data.
Accessing the Cloudera Navigator Console
The Cloudera Navigator console can be accessed from the Cloudera Manager Admin Console or directly on the Navigator Metadata Server instance. Only Cloudera Manager users with the role of Navigator Administrator (or Full Administrator) can access Cloudera Navigator console from the Cloudera Manager Admin Console.
- Open your browser.
- Navigate to the Cloudera Manager Admin Console.
- Log in as either Navigator Administrator or Full Administrator.
- From the menu, select .
- Select Cloudera Navigator from the menu.
- Log in to the Cloudera Navigator console.
Menu and Icon Overview
The Cloudera Navigator console opens to an empty Search results page and displays the following menu.
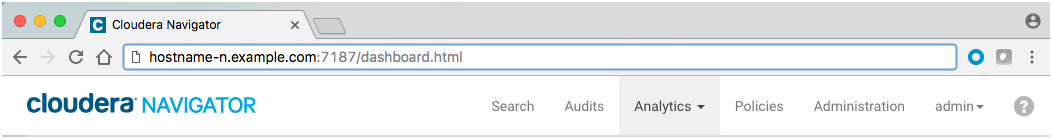
The user_name (the account that is logged in to Cloudera Navigator) and question mark icon (see the table) always display. However, other available menu choices depend on the Cloudera Navigator user role of the logged in account. In this example, the admin account is logged in. That account has Navigator Administrator privileges which means that all menu items display and the user has full access to all system features. For a user account limited to Policy Editor privileges, only the Policies menu item displays.
| Icon or menu | Description |
|---|---|
| Search | Displays sets of filters that can be applied to find specific entities by source type, type, owner, cluster name, and tags. |
| Audits | Displays summary list of current audit events for the selected filter. Define filters for audit events, create reports based on selected time frames and filters, export selected audit details as CSV or JSON files. |
| Analytics | Menu for HDFS Analytics and Data Stewardship Analytics selections. This is your entry point for several dashboards that display the overall state of cluster data and usage trends: |
| Policies | Displays a list of existing policies and enables you to create new policies. |
| Administration | Displays tabs for Managed Metadata, Role Management, and Purge schedule settings. |
| user_name | Displays account (admin, for example) currently logged in to Cloudera Navigator. Menu for Command Actions, My Roles, Enable Debug Mode, and Logout selections. |
| Help icon and menu. Provides access to Help, API Documentation, and About selections. Select Help to display Cloudera Navigator documentation. Select About to display version information. |
This is just an overview of the menu labels in the Cloudera Navigator console and pointers to some of the sub-menus. See the Cloudera Navigator Data Management guide for details.
Displaying Documentation
Online documentation is accessible from Cloudera Navigator console as follows:
- Click Help.
- Select Help from the menu.
The Cloudera Data Management guide displays.
Note: You can also view the Cloudera Data Management guide outside the scope of a running instance of Cloudera Navigator. See
also the complete list of other Cloudera Navigator data management component documentation.Displaying Version Information
- Click Help.
- Select About from the menu. The versions for both Cloudera Navigator and the Cloudera Manager instance with which it is associated display, as shown
below:
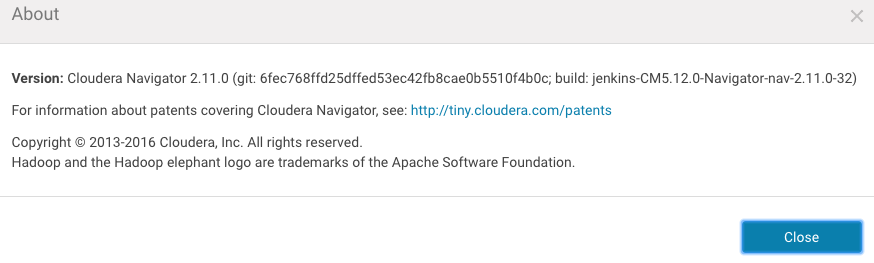
- Click Close to dismiss the message and redisplay the Cloudera Navigator console.
Cloudera Navigator APIs
Cloudera Navigator exposes REST APIs on the host running the Navigator Metadata Server role. In-house, third-party, and other developers can use the APIs to provide functionality not currently available through the Cloudera Navigator console or to customize their users' experience.
The APIs are used by the Cloudera Navigator console at runtime as users interact with the system. The Cloudera Navigator console has a debug mode that captures API calls and responses to a file that can then be downloaded and analyzed. See Using Debug Mode for details.
Documentation and a brief tutorial for the Cloudera Navigator APIs are available on the same node of the cluster that runs the Navigator Metadata Server role. These are also accessible from the Cloudera Navigator console. Example pathnames for direct access (outside the Cloudera Navigator console) are shown in the table.
| Resource | Default location |
|---|---|
| APIs | http://fqdn-n.example.com:port/api/vn/operation |
| API Documentation | http://fqdn-n.example.com:port/api-console/index.html |
| API Usage Tutorial | http://fqdn-n.example.com:port/api-console/tutorial.html |
Operations on the API are invoked using the following general pattern:
http://fqdn-n.example.com:port/api/vn/operation
The n in vn for the APIs represents the version number, for example, v11 for the Cloudera Navigator version 2.11.x. The API version number is located at the bottom of the Cloudera Navigator API documentation page.
The API uses HTTP Basic Authentication and accepts the same users and credentials that have access to the Cloudera Navigator console.
The resources listed in the table are aimed at technical and general audiences for Cloudera Navigator Data Management. The GitHub repository is aimed at developers.
| Resource | Default location |
|---|---|
| GitHub cloudera/navigator-sdk | Cloudera Navigator SDK is a client library that provides functionality to help users extract metadata from Navigator and to enrich the metadata in Navigator with custom metadata models, entities, and relationships. |
| Cloudera Community Data Management forum | Cloudera Community > Data Management > Data Discovery, Optimization forum for Cloudera Navigator users and developers. |
| Cloudera Engineering Blog | In-depth technical content provided by Cloudera engineers about components and specific subject areas. |
Accessing API Documentation
The API documentation is available from the Cloudera Navigator console from a menu selection that navigates to the same URL listed in the table above.
To access the API documentation and tutorial:
- Click Help.
- Select API Documentation. The interactive API documentation page displays in a new window.
- Click the Tutorial link near the top of the page to view the Cloudera Navigator API Usage Tutorial to learn about the APIs.
Locating the Version Information for the Navigator API
- Click Help.
- Select API Documentation to display the API documentation.
- Scroll to the bottom of the page. The version number is the last item on this page:

The API is structured into resource categories. Click a category to display the resource endpoints.
Using Debug Mode
Cloudera Navigator console debug mode captures API responses and requests during interaction with the server. Use debug mode to facilitate development efforts or when asked by Cloudera Support to troubleshoot issues.
 Tip: Exploring debug files can be a good way to learn about the APIs.
To follow these steps you must be logged in to the Cloudera Navigator console.
Use Debug Mode to Collect Files for Troubleshooting
The general process for obtaining debug files to send to Cloudera Support is as follows:
- Navigate to the Cloudera Navigator console menu item or page for which you want to obtain debug information.
- Enable debug mode.
- Reload the page and perform the specific action. For example, if you need to send a debug file to Cloudera Support for an error message that displays when you click on an entity in one of the charts, perform that action to raise the error message.
- Download the debug file or files. Each time the counter changes, the content of the debug file content changes, so you should download each time the counter updates.
- Disable debug mode.
Enable Debug Mode
- Log in to the Cloudera Navigator console.
- Select .
The Cloudera Navigator consoles displays a notification message in the bottom right of the page:

Notice the links to Disable and Download debug file, which you can use at any time to do either. Do not disable debug mode until you have downloaded the debug file you need. - Reload the browser page.
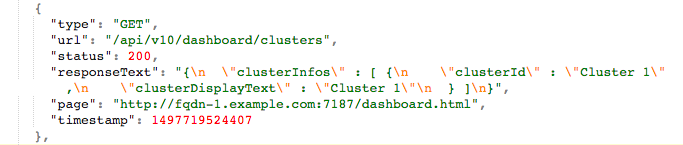
The counter n displays the number of API calls captured in the debug file for the current session interaction. Here is
an example from a downloaded debug file showing one of the responses after reloading the page:
Download Debug File or Files
As you perform actions with the Cloudera Navigator console, the counter refreshes and keeps tracks of current calls only (stateless nature of REST). In other words, download the debug file for any given action or selection that you want to examine.
- Enable Debug Mode if you haven't already.
- Click the Download debug file link in the debug-enabled notification message, bottom right corner of the page.
- Save the file to your local workstation.
api-data-fqdn-yyyy-mm-ddThh-mm-ss.jsonFor example:
api-data-fqdn-2.example.com-2017-06-15T09-00-32.json
Disable Debug Mode
- Click the Disable debug mode link in the notification message box.
- Select .
Cloudera Navigator Data Management Documentation Library
The Cloudera Documentation portal includes the following information for Cloudera Navigator data management component:
| FAQ | Cloudera Navigator Frequently Asked Questions answers common questions about Cloudera Navigator data management component and how it interacts with other Cloudera products and cluster components. |
| Introduction | Cloudera Navigator Data Management Overview provides preliminary information about common Cloudera Navigator data management for data stewards, governance and compliance teams, data engineers, and administrators. Includes an introduction and overview of the Cloudera Navigator console (the UI) and the Cloudera Navigator API. |
| User Guide | Cloudera Navigator Data Management guide shows data stewards, compliance officers, and other business users how to use Cloudera Navigator for data governance, compliance, data stewardship, and other tasks. Topics include Auditing, Metadata, Lineage Diagrams. The guide includes a Services and Security Management chapter that shows systems administrators how to configure, customize, and tune the back-end services, and how to integrate Cloudera Navigator and the Cloud. |
| Installation | Installing the Cloudera Navigator Data Management Component |
| Upgrade | Upgrading the Cloudera Navigator Data Management Component |
| Security | Configuring Authentication for Cloudera Navigator |
| Configuring TLS/SSL for Navigator Metadata Server | |
| Release Notes | Cloudera Navigator Data Management Release Notes includes new features, changed features, known issues, and resolved issues for each release. Current users of Cloudera Navigator data management component should always read the release notes before upgrading. |
| << Cloudera Navigator Data Management Overview | ©2016 Cloudera, Inc. All rights reserved | Cloudera Navigator Frequently Asked Questions >> |
| Terms and Conditions Privacy Policy |