Navigator APIs Overview
Documentation and a brief tutorial for the Navigator APIs are available on the same node of the cluster that runs the Navigator Metadata Server role. These are also accessible from the Cloudera Navigator console. Example pathnames for direct access (outside the Cloudera Navigator console) are shown in the table.
| Resource | Default location |
|---|---|
| APIs | http://fqdn-n.example.com:port/api/vn/operation |
| API Documentation | http://fqdn-n.example.com:port/api-console/index.html |
| API Usage Tutorial | http://fqdn-n.example.com:port/api-console/tutorial.html |
Operations on the API are invoked using the following general pattern:
http://fqdn-n.example.com:port/api/vn/operation
The n in vn for the APIs represents the version number, for example, v11 for the Cloudera Navigator version 2.11.x. The API version number is located at the bottom of the Cloudera Navigator API documentation page.
The API uses HTTP Basic Authentication and accepts the same users and credentials that have access to the Cloudera Navigator console.
The resources listed in the table are aimed at technical and general audiences for Cloudera Navigator Data Management. The GitHub repository is aimed at developers.
| Resource | Default location |
|---|---|
| GitHub cloudera/navigator-sdk | Cloudera Navigator SDK is a client library that provides functionality to help users extract metadata from Navigator and to enrich the metadata in Navigator with custom metadata models, entities, and relationships. |
| Cloudera Community Data Management forum | Cloudera Community > Data Management > Data Discovery, Optimization forum for Cloudera Navigator users and developers. |
| Cloudera Engineering Blog | In-depth technical content provided by Cloudera engineers about components and specific subject areas. |
Continue reading:
Accessing API Documentation
The API documentation is available from the Cloudera Navigator console from a menu selection that navigates to the same URL listed in the table above.
To access the API documentation and tutorial:
- Click Help.
- Select API Documentation. The interactive API documentation page displays in a new window.
- Click the Tutorial link near the top of the page to view the Cloudera Navigator API Usage Tutorial to learn about the APIs.
Locating the Version Information for the Navigator API
- Click Help.
- Select API Documentation to display the API documentation.
- Scroll to the bottom of the page. The version number is the last item on this page:

The API is structured into resource categories. Click a category to display the resource endpoints.
Using Debug Mode
Cloudera Navigator console debug mode captures API responses and requests during interaction with the server. Use debug mode to facilitate development efforts or when asked by Cloudera Support to troubleshoot issues.
 Tip: Exploring debug files can be a good way to learn about the APIs.
The general process for obtaining debug files to send to Cloudera Support is as follows:
- Navigate to the Cloudera Navigator console menu item or page for which you want to obtain debug information.
- Enable debug mode.
- Reload the page and perform the specific action. For example, if you need to send a debug file to Cloudera Support for an error message that displays when you click on an entity in one of the charts, perform that action to raise the error message.
- Download the debug file or files. Each time the counter changes, the content of the debug file content changes, so you should download each time the counter updates.
- Disable debug mode.
To follow these steps you must be logged in to the Cloudera Navigator console.
Enable Debug Mode
- Click the user_name from the menu to open the drop-down menu.
- Select Enable Debug Mode. The Cloudera Navigator consoles displays a notification message in the bottom right of the page:

Notice the links to Disable and Download debug file, which you can use at any time to do either. Do not disable debug mode until you have downloaded the debug file you need. - Reload the browser page.
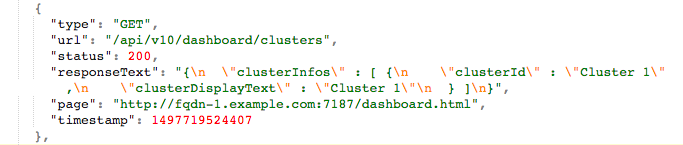
The counter n displays the number of API calls captured in the debug file for the current session interaction. Here is
an example from a downloaded debug file showing one of the responses after reloading the page:
Download Debug File or Files
As you perform actions with the Cloudera Navigator console, the counter refreshes and keeps tracks of current calls only (stateless nature of REST). In other words, download the debug file for any given action or selection that you want to examine.
- Click the Download debug file link in the debug-enabled notification message.
- Save the file to your local workstation.
api-data-fqdn-yyyy-mm-ddThh-mm-ss.jsonFor example:
api-data-fqdn-2.example.com-2017-06-15T09-00-32.json
Disable Debug Mode
- Click the Disable debug mode link in the notification message box.
- Select .
Set Debug Logging Levels
The Cloudera Navigator Debug Mode allows you to configure the logging levels for individual methods in the application code. For example, to increase the logging detail for API calls, you would set the logging level for the org.apache.cxf.interceptor class to "DEBUG" level. If you are collecting debugging information for a specific issue, Cloudera support will provide the class name.
To set the logging level for a Cloudera Navigator application class:
- Log in to the Cloudera Navigator console.
- Add /debug to the Navigator URL:
http://fqdn-a.example.com:7187/debug
The debugging console appears.
- Click Configure Logging.
- In the Logger drop-down menu, select a Navigator class, such as org.apache.cxf.interceptor for API calls.
- Set the logging level for the class.
For example, for the API call logging, select DEBUG.
- Click Submit.
When changed in Debug Mode, logging levels will return to their default values after restarting the Navigator Metadata Server. To permanently change the logging levels, use Cloudera Manager to add an entry in the Navigator Metadata Server Logging Advanced Configuration Snippet. Create the entry as follows:
log4j.logger.<classname>=<level>
For example, to set the API logging level to "DEBUG", include the following string in the Advanced Configuration Snippet:
log4j.logger.org.apache.cxf.interceptor=DEBUG
See Modifying Configuration Properties Using Cloudera Manager.
| << Cloudera Navigator APIs | ©2016 Cloudera, Inc. All rights reserved | Applying Metadata to HDFS and Hive Entities using the API >> |
| Terms and Conditions Privacy Policy |